

The manufacturer sent dealers comparison curves to fight back and accidentally confirmed the problem.
An $11,000 speaker should invite close scrutiny, especially when independent tests reveal a clear weakness in the midrange. That is what happened when Erin Hardison measured the Børresen X3 with a Klippel scanner and found the same dip in two separate samples.
Børresen later questioned his method and sent dealers a set of comparison curves. Those curves became the key evidence. They showed broad agreement through much of the midrange and treble, along with a larger gap in the bass that the available test details could not fully explain.
Here is what the measurements show, where the data still conflicts, and what buyers should take from it.
The X3’s Measured Midrange Dip
The Børresen X3 is an $11,000 pair of floorstanding speakers built around a planar ribbon tweeter and three 4.5-inch drivers. It sits near the middle of Børresen’s X series, although its price places it firmly in the premium speaker market.
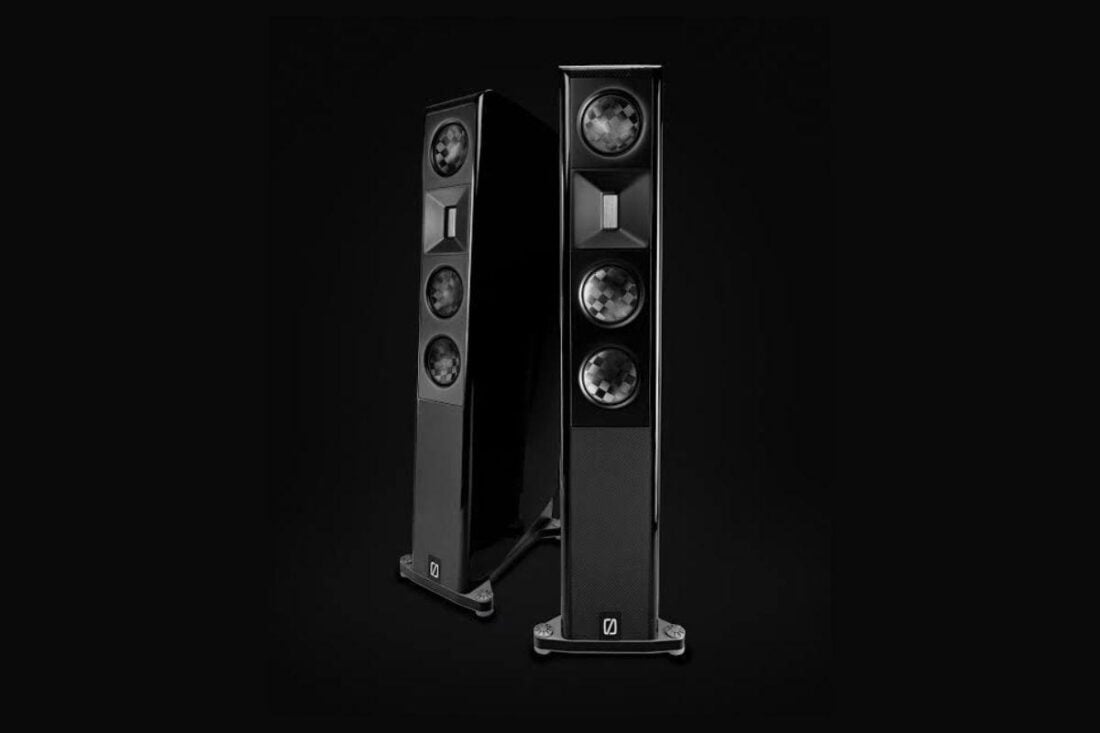
In November 2024, Erin Hardison tested the X3 using a $100,000 Klippel Near-Field Scanner, a robotic measurement system also used by speaker manufacturers during product development.
His test followed the ANSI/CTA-2034-A standard and captured the speaker’s output from multiple angles. The scanner then reconstructed how the X3 radiates sound both on-axis and away from the main listening position.
The results showed what Hardison described as a “notable hole in the mid-range frequencies.” In his assessment, the depression altered the speaker’s tonal balance.
But even with that dip, the X3 showed several strengths. It produced solid output around 80 Hz, maintained a relatively linear treble response, and delivered good imaging, though bass output fell more sharply below 50 Hz.
Testing a second sample also produced a closely matching curve.
That consistency made shipping damage or an isolated manufacturing defect less likely and pointed instead to the speaker’s design or tuning.
Børresen Challenged the Method
Before publishing the review, Hardison said he contacted Børresen and gave the company two weeks to respond or provide its own measurements. But no direct reply came during that period.
Once the review was public, however, Børresen circulated a memo to its dealer network challenging both his method and the conclusions drawn from it.
The company’s main concern was that Hardison had tested the X3 in a normal room rather than what Børresen described as an “IEC sound dead room.”
Although the Klippel Near-Field Scanner operates inside an ordinary physical space, it gathers thousands of measurements close to the cabinet and mathematically separates the speaker’s direct output from surrounding reflections. And by reconstructing the speaker’s radiation pattern from those measurements, the scanner can produce anechoic-equivalent data without requiring a full anechoic chamber.
Still, Hardison argued that the memo treated the room as though its reflections were part of his final result.
He also objected to Børresen questioning his measurement position and angle without identifying a specific failure in the Klippel process or showing how it had distorted the curve.
Børresen did provide some information about two later outdoor measurements included in its response, though.
According to Hardison’s reproduction of the company’s descriptions, the blue curve was taken at one metre on the tweeter axis. The green curve placed the microphone lower to approximate a listener seated 90 centimetres high at a distance of three metres.
Those details made the company’s comparison easier to interpret. However, the memo still left out the exact IEC standard used for the original room measurement, along with the full processing method, gating, smoothing, and other conditions needed to reproduce the comparison.
As a result, Børresen’s response narrowed the disagreement without resolving it. It raised valid questions about microphone height and listening axis, yet never identified a specific flaw in Hardison’s Klippel procedure or showed that a corrected test would eliminate the midrange dip
The Curves Agreed More Than the Memo Suggested
The dispute looked less dramatic once the available response curves were placed on comparable scales.

Manufacturer graphs can appear smoother or more uneven depending on the vertical range shown. A wider decibel scale compresses visible variations, while a narrower one makes smaller changes appear more pronounced.
After Hardison adjusted for the scale used in Børresen’s graph, the company’s data and his own results aligned more closely above roughly 200 to 300 Hz.
After adjusting for those presentation differences, Hardison found that Børresen’s published curve tracked his own much more closely above roughly 200 to 300 Hz. And, an independent measurement from Stereo.de also showed a similar overall pattern through much of the midrange and treble.
That gave the dispute three relevant datasets:
- Hardison’s Klippel measurements
- Børresen’s published response curve
- Stereo.de’s independent measurements
Across these three datasets, the X3 did not look like three entirely different speakers. Each curve showed broadly comparable upper-frequency behavior, including a depression through part of the midrange, even though the depth and shape varied.
But the largest unresolved disagreement remained in the lower frequencies.
Bass measurements are especially sensitive to distance, room treatment, gating, near-field splicing, and the way driver and port output are combined.
Because Børresen and Stereo.de did not publish enough of those conditions, the source of the low-frequency difference cannot be identified from the graphs alone.
Positive Reviews Did Not Resolve the Dispute
French audio publication VUMETRE also reviewed the Børresen X3, combining technical observations with extended listening impressions. Its verdict was far more positive than Hardison’s, praising the speaker’s clarity, neutral timbre, speed, and integration between the ribbon tweeter and the midrange drivers.
VUMETRE did not identify the midrange weakness Hardison described. The measured depression still appeared in multiple curves, but the review shows that at least one listener did not consider it a major flaw.
Room acoustics, placement, listening distance, volume, and music choice can all change how strongly a response irregularity is perceived. Its audible effect also depends on the width and depth of the dip, where it falls in the frequency range, and how the speaker’s direct sound blends with its off-axis output in the room.
This doesn’t make any of the two reviews invalid, though.
One reason the two reviews could diverge is that a response dip is not heard in isolation. Placement, listening distance, volume, music choice, and room acoustics all affect how strongly it registers. Its width and depth matter too, along with the way the X3’s direct sound blends with its off-axis output before reaching the listener.
The measurements therefore remain more consistent than the listening impressions. But accurate data alone cannot settle those questions.
Veteran loudspeaker designer Andrew Jones, whose career includes decades of developing and measuring speaker systems, addressed the broader issue during Audio Advice Live 2025.
While Jones was not referring to the X3 or Hardison directly, his point was that advanced equipment can produce accurate measurements without guaranteeing equally sound conclusions.
In the X3 dispute, for instance, the measurements are more consistent than the listening impressions. Two samples showed the same depression, and similar behavior appeared in other published curves. Reviewers remain divided, however, on whether the dip meaningfully weakens the speaker’s performance.
The Data Narrowed the Dispute but Did Not End It
Once the available curves were placed on comparable scales, the disagreement became smaller and more specific. Hardison’s measurements, Børresen’s published response, and the independent Stereo.de result all showed broadly similar behavior through much of the midrange and treble, including a depression through part of the midrange.
The strongest mismatch remained in the bass, where differences in distance, gating, splicing, room conditions, and processing can substantially change the result. Because Børresen and Stereo.de did not publish enough detail to reproduce their full tests, the source of that discrepancy remains unclear.
None of this establishes that every listener will consider the X3’s midrange dip severe. VUMETRE’s positive review shows that the speaker’s clarity, speed, and imaging could still dominate the listening experience in another room and setup.
Børresen’s memo also fell short of invalidating Hardison’s work.
It raised relevant questions about measurement position and interpretation, yet never identified a reproducible error in his Klippel procedure or showed that correcting one would remove the dip.
For an $11,000 speaker, buyers are therefore left with a clearer picture rather than a definitive verdict: the midrange depression appears real, its audible importance varies, and the manufacturer has not published enough technical detail to settle the remaining disagreement.