What Exactly Is Being Measured?
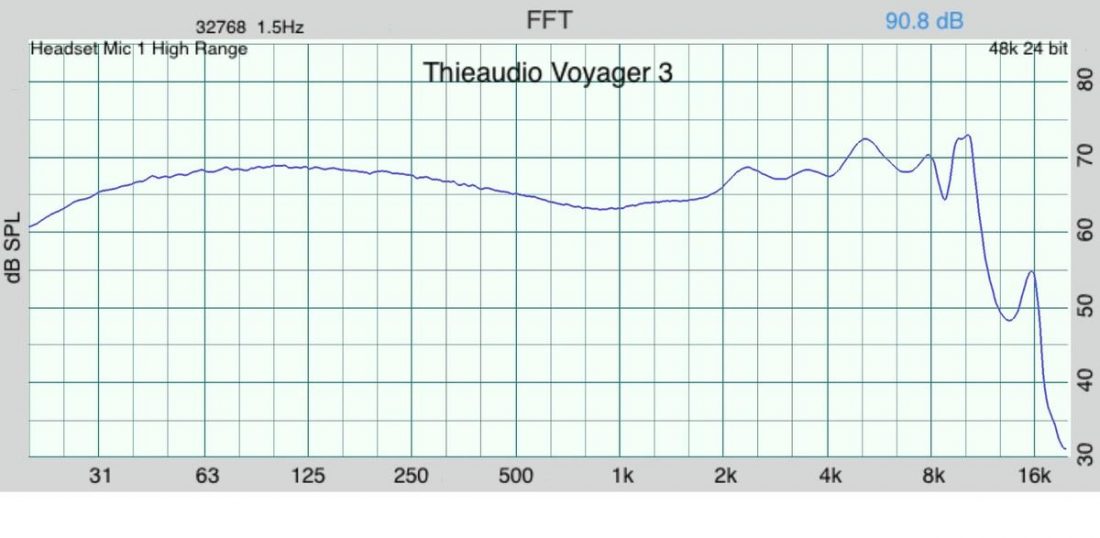
The typical result of a headphone measurement is a Fast Fourier Transform (FFT) graph. This graph typically shows the Sound Pressure Level (SPL) on the vertical axis and the Frequency Range of human hearing (20Hz – 20kHz) on the horizontal axis.
The graphed line shows the relative loudness of each frequency that the headphone reproduces. Large spikes or dips in the graph indicate uneven boosting or dropping of frequencies.
In general, bass frequencies are shown on the graph under 250Hz, midrange frequencies from 250Hz – 5kHz, and treble frequencies above that. Low or high-frequency roll-off can easily be seen on this type of graph by a sharp decline above or below a specific frequency.
Why Do We Measure Headphones and IEMs?
How can you tell if one headphone sounds better than another? Isn’t it entirely a subjective process, where our preferences and expectations come into play? But headphone enthusiasts seem to feel that some sort of inherent ranking list is possible if the plethora of rating scales, tiers, and best-of lists are any sort of indicator.
The reviewer’s predilections and experiences shape their impressions of a headphone. There is no certainty that the reviewer’s tastes match your own, and only through gathering the impressions from several trusted reviewers can one feel any confidence in ratings and reviews.
However, almost every headphone or IEM review includes a measurement graph to try to add an objective analysis to the purely subjective content of a review. Unfortunately, it is not as easy as trusting the measurements as an absolute indicator of sound quality.
How Do We Measure Them?
Headphone Measurement Tools
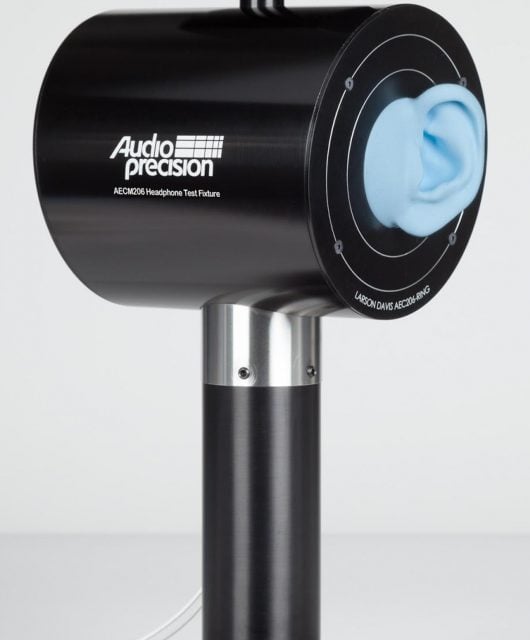
Originally used to design and test hearing aids, professional headphone measurement devices are very expensive (often measured in thousands, if not tens of thousands of dollars). Recently the miniDSP EARS testing jig was released for a fraction of the cost, and while not the equal of pro-level devices, is entirely acceptable for headphone enthusiasts.
The EARS is a testing rig that uses microphones fitted in silicone simulated ears to record data via a computer connection. Test tones are played through a pair of headphones fitted on the device. It consists of 3 parts:
- Stand
- Interface Surface (simulated ears)
- Microphones
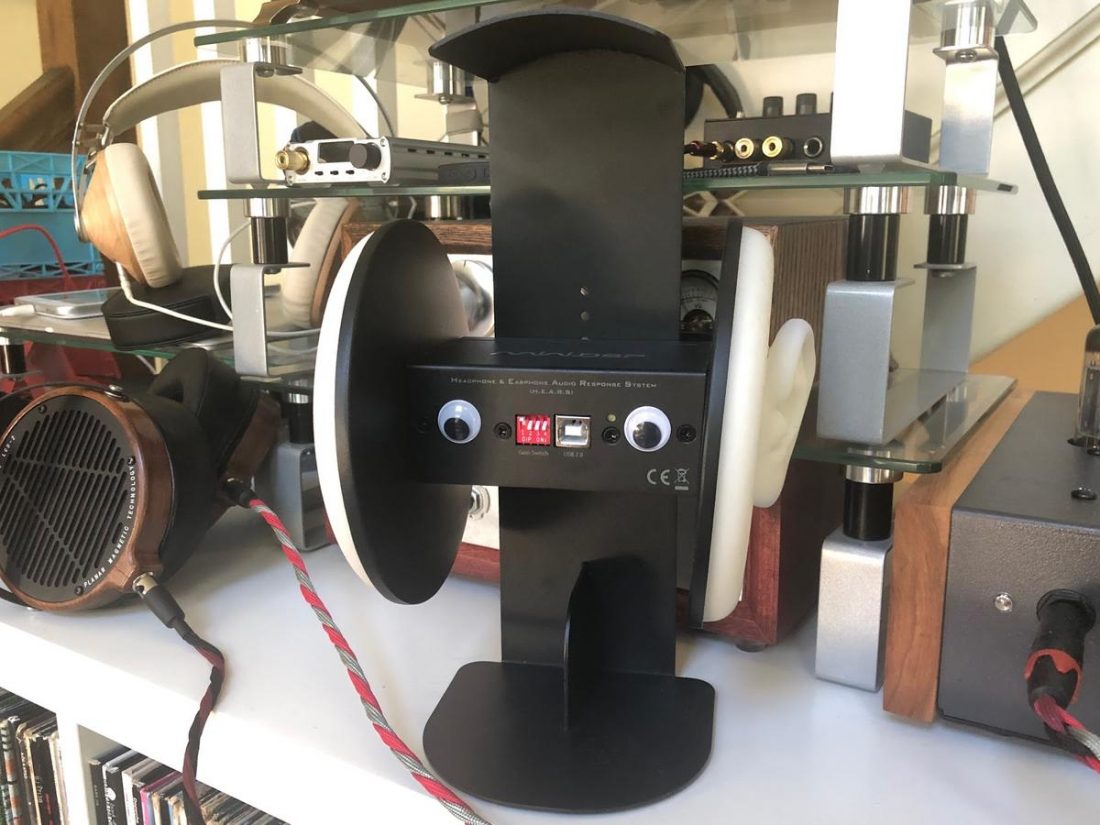
The EARS is very easy to use, included comprehensive instructions, and is becoming so popular that its ubiquity adds validity to its usage.
The hardware would be useless without software to capture the measurements and organize the data in a worthwhile way. Fortunately, the measurement community has almost entirely settled on using the free and generally well-regarded Room Equalization Wizard (REW) software. It works on Windows, Apple OS, and Linux without installing drivers.
Calibration Files
Calibration files are applied to most headphone measurements as compensation for the particular characteristics of the measurement rig, and there are ongoing debates and discussions as to what is the ‘right’ compensation to use.
All measurement devices typically use some type of compensation. The EARS User Manual states that the “EARS is not an IEEE-standard ear simulator (those are very expensive). So, its compensations need to be different from those used with expensive measurement rigs (or published in research papers).”
A calibration file applies a uniform change to the graphed results. The calibration files serve three purposes:
- Correct the frequency response between the individual (left and right) microphone capsules.
- Correct for any SPL sensitivity difference between the left and right capsules.
- To apply compensation so that the produced measurement is more easily and usefully interpreted.
The miniDSP EARS is not the Right Solution for Measuring IEMs
We purchased the miniDSP EARS testing device to make headphone frequency response measurements, however, it soon became apparent that this device wasn’t a good fit for making IEM measurements. Where the miniDSP EARS features simulated silicon ears that function decently for making on or over-ear headphone measurements, the shallow round hole (that simulates the ear canal) is less than ideal for IEMs.
Try as I might, I couldn’t get a great seal with any ear tips, and my results broke the cardinal rules of valid measurements: consistency and repeatability. Seemingly small changes in the position of the IEMs led to significant changes in the measured results. If I couldn’t trust my own results between measurement attempts, those results simply couldn’t be used.
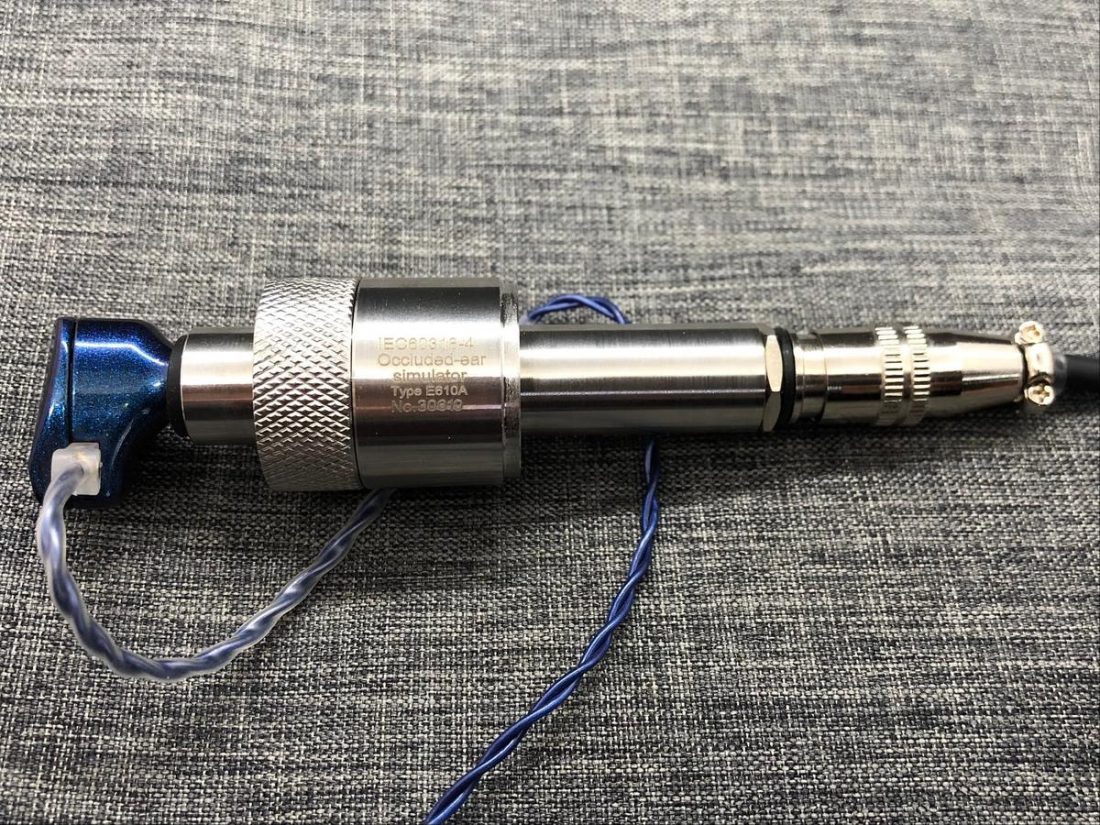
The solution was to talk with the expert. Corin Ako, or Crinacle as he’s known online, tends the most complete IEM measurement database on In-Ear Fidelity, and it was his help I sought for sourcing a proper IEM measurement setup. While he’s recently changed to multi-thousand-dollar industry-standard tools, the bulk of his measurements were done with an affordable and portable setup.
Can We Trust Measurements?
We must know how the measurements are completed for us to trust them. When considering measurements, you should make sure of the following:
- Conditions, equipment, setting, and standards are stated.
- Expectations and limitations are stated and understood.
- Compared graphs must show the same range, scale, aspect ratio, and smoothing.
Measurements can only be compared (between measurements done by the same reviewer or by multiple reviewers) if the same measurement conditions are maintained. This includes both hardware and software settings.
Measurements Do Not Equate To Sound Quality
Remember, there is no single consensus on what the ideal measured frequency response of a pair of headphones should be. So, although headphone measurements are often presented as an objective part of a review, interpreting those results is entirely subjective.
Listening is the only way to validate if the graph accurately depicts the sound.
Conclusion
All headphone reviews are subjective, even those that include a frequency response measurement graph. The graph is only useful if you know how it was created, and can only be compared directly to other measurement graphs generated in the exact same way. Measurements are subjectively interpreted and can never replace the best tools for the job, your ears!