This article compares the Harman curves with alternative solutions proposed in Part 2, as well as other correction curves.
“A Deep Dive Into Harman Curves” Series Navigation:
The Role of Harman
But where does Harman come into all this?
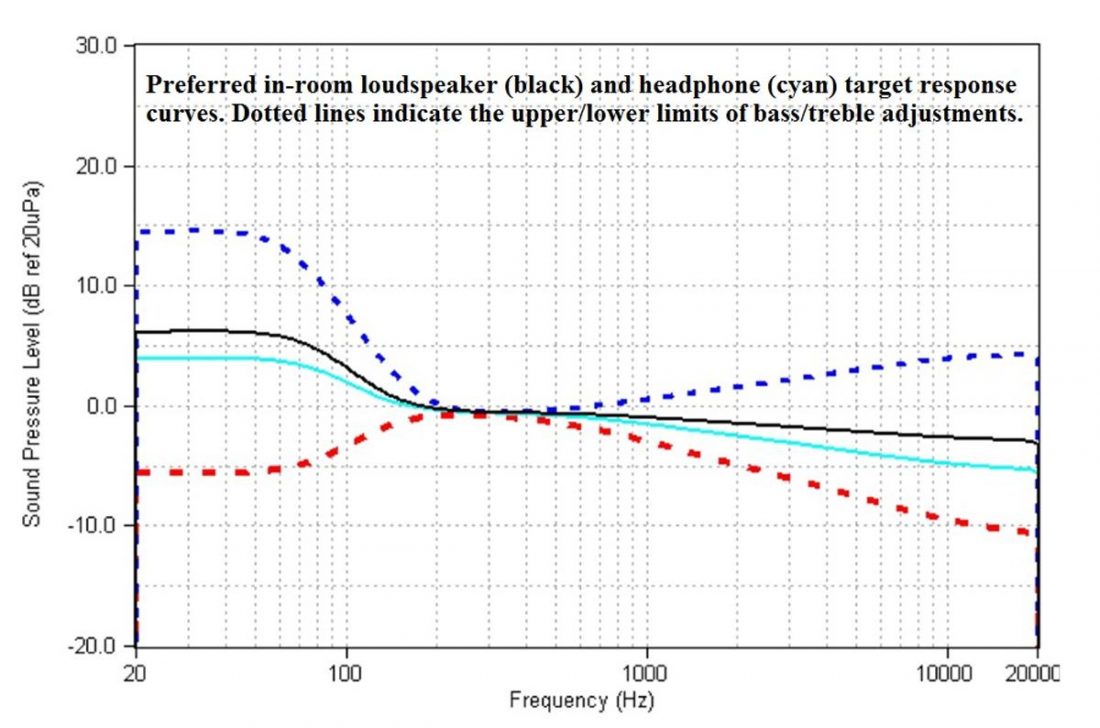
As Tyll’s brilliant coverage indicates, Harman made waves with a seminal series of papers on loudspeaker preference. A broad preference toward speakers that measure flat with smooth dispersion across all frequencies was observed, regardless of listener background in a well-treated listening room under rigorous blind testing. This is consistent with how human hearing functions in listening rooms.
From there, attempts were made to replicate the results for headphones. Thus, industry-standard dummy head measurements were made of their reference loudspeaker setup. The Harman headphone curve(s) was a derivation of their speaker work. The resulting curve was tested with listeners for preference as well. These were the results for circumaural headphones and IEMs:
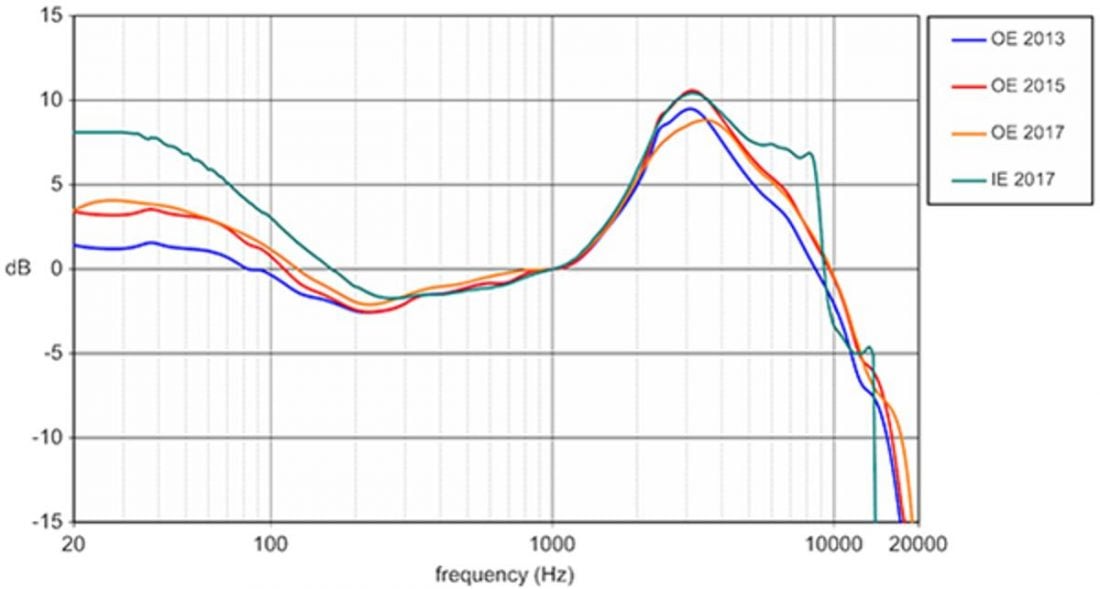
Comparison of three Harman circumaural headphone target curves over the years and one IEM curve. Credit: innerfidelity.com
Sean Olive, the Harman researcher leading much of the project, provided a further update in late 2019. Across a large and diverse body of listeners, three distinct sub-groups existed:
”Harman curve Lovers”: This group, which constitutes 64% of listeners, includes mostly a broad spectrum of people, although they’re generally under age 50. They prefer headphones tuned close to the Harman curve.
“More Bass Is Better”: This next group, which makes up 15% of listeners, prefers headphones with 3 to 6dB more bass than Harman curve below 300Hz, and 1dB more output above 1kHz. This group is predominantly male and younger — the listeners JBL is targeting with its headphones.
“Less Bass Is Better”: This group, 21% of listeners, prefers 2 to 3dB less bass than the Harman curve and 1dB more output above 1kHz. This group is disproportionately female and older than 50.”
Variance in Preferences
Moreover, bass and treble balance can still vary on a case-to-case basis, depending on recording, age, gender and listening experience. The broad features of Head Related Transfer Function (HRTF) of a smooth, well-engineered speaker (in a room rather than anechoic chamber) rated highly in blind tests were captured. However, the authors concede that there can be room for variance based on the tonal balance of the recording and listener preference.
Nonetheless, it is a tonal correction that is broadly optimal by accounting for key components of the human HRTF in coarse detail (through the dummy head). Thus, it stops well short of full spatial and tonal fidelity and still needs individualization. After all, HRTF can vary as much as 20dB in some areas between individuals.
Headphone Placement Variance
Another big issue is the variance with each headphone placement, which can be very narrowband effects at high frequencies, where the variance in positioning is significant relative to the wavelength of sound. Moreover, there is an observer effect: attempts to measure this variance would not be accurate in situ, because the act of measuring introduces its own variance.
This is difficult to compensate. Nonetheless, it captures the crucial features that are most shared. Such a target curve has the best chance of being preferred, or requiring the least modification to be preferable compared to an arbitrary curve.
Nonetheless, the Harman curve, in whatever form, lacks compensation for other binaural cues, such as crossfeed.
This implies that precise fidelity to an individual’s spatial hearing is unlikely to be achieved, and interaural cues are neither generated (as in crossfeed) nor uncovered (as in crosstalk cancellation).
It should also be said at this point that, despite the room for variance, frequency response that grossly differ to the key shared features are very likely to be perceived as sounding odd.
A classic example is the Audioquest Nighthawk, which lacks the 3kHz peak consistent with the human ear resonance that is highly consistent across all individuals despite nuanced differences between them.
In short: the coarseness of the Harman curve also implies that large, fundamental deviations from what is already a coarse curve is likely to be perceived as colored.
Moreover, where there is a sound, established physiological reason for the frequency response feature (in this case the 3kHz peak), a design that goes the other way – to exhibit a dip in the region – demonstrably goes against what human ear physiology prescribes for a natural, smooth sound source (in this case, a loudspeaker in a well-treated room) outside of our ears.
Variance Between Design Formats
Additionally, the Harman curve differs between different design formats: in-ear monitors and headphones require a markedly different configuration due to the difference in the way they interact with the ear. In this detailed presentation by Sean Olive, several hypotheses are forwarded for the difference. For one, over-ear headphones radiate a wavefront that interacts with the pinna, but this is not true for IEMs.
Having an ear canal blocked (instead of open) alters the resonant characteristics of the canal. The seal of IEMs may also affect the preferred low-end balance. The new curve for IEMs appears to reflect these reasons, with the general shape of the 3kHz peak significantly different.
Experiment vs Ideal
However, the Harman curve is an experimentally-derived curve, that is less abstract than the two most common and idealized calibration curves that predate it:
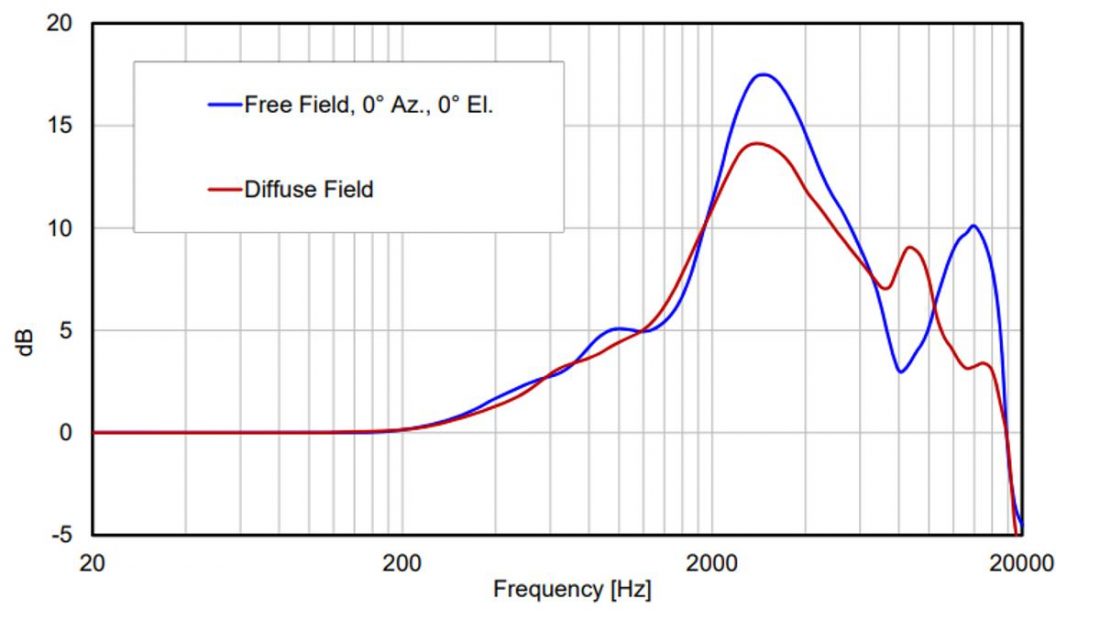
- One is the free-field curve;
- the other the diffuse-field curve.
An excellent post by Reddit user oratory1990, a professional audio engineer, sums up the difference.
Difference between free-field curve and Harman curve
The free-field curve is the response of a well-designed loudspeaker in an anechoic room (yielding a flat, smooth anechoic response), placed in front of a dummy head. In contrast, the Harman curve uses a realistic, treated domestic room designed to have some controlled reflections and absorption that appear preferable, which tends to shelve response down into a smooth downward slope for flat and smoothly-dispersing loudspeakers (with very rare exceptions).
The problem is the free-field curve gets “very wobbly above 5 kHz, due to specific resonance and phase effects that occur at specific distances and angles. It’s hard to manufacture headphones that reproduce all these wobbles exactly right.”
Diffuse-field curve – one without wobbles
An alternative idealized curve was sought, without the wobbles. The diffuse-field curve was this curve. As oratory1990 puts it:
Instead of putting a single speaker directly in front of the head, we place the head in a very reverberant room, so that sound arrives at the head from all angles and from all directions equally.
The reasoning behind this idea was that sound arrives from all angles as well when wearing headphones – simply because the headphones cover the whole ear…
The frequency response in the room is still linear and flat – but the sound is coming from all directions and not just from the front (as in the free field). Now, when we measure the frequency response of the diffuse field with an artificial head, the resulting curve is much smoother above 5 kHz.
Thus, headphones could be reliably tuned to a smooth curve rooted in broad human features. The idealized abstraction of both curves was their downfall, though, because studios and listeners both did not produce and play back recordings with transducers that adhered to this curve. Instead, diffuse-field playback of music recordings was likely to be brighter despite the idealized abstraction.
At its heart, the Harman curve is an exercise in consumer research coupled to psychoacoustics. It is descended from the search for a curve that references broad features of human hearing, in conditions that reflect average conditions used in both recording and playback, while providing leeway to tweak to taste according to recordings, because the difference in recording conditions mean recordings were not made in studios with uniform sound (the “circle of confusion”).
It is in that sense, a robust starting point to tune to taste tonally, but without any controlled technique for accuracy to the individual, either through loudness comparison or microphones.
Griesinger Pink Noise Curve
There is a minor revival of an approach, however, that skews more toward coarse individualization. Remember David Griesinger? He is a proponent of individualized headphone equalization. However, instead of intrusive measurements with delicate specialized equipment (such as calibrated in-ear miniature microphones), he suggests using loudness comparison.
Using a known flat/accurate loudspeaker positioned in front and up close (to minimize room effects), alter the loudness of pink noise at different frequencies (every one-third of an octave) until they sound similarly loud to a pink noise at a reference frequency (500Hz). Repeat for the whole audioband. Then repeat for headphones.
The difference between the curve generated with the speaker and the headphone is therefore the individual calibration curve, measured at a coarse and non-invasive level, but nonetheless close enough to the HRTF to ensure externalization.
Griesinger is quick to clarify that he did not originate this method; but revived it from IEC publication 268-7 and German Standard DIN 45-619, precursors to the diffuse-field method proposed by Gunther Theile. It is experimental instead of idealized. Moreover, instead of looking at a coarse average that collapses the variation between individual listeners, their loudspeakers, and the studio, it is a coarse approximation of the individual’s curve.
Nonetheless, such a curve is good enough – providing sufficient individualized tonal accuracy in terms of being faithful to individual HRTF, sidestepping thorny issues of varying listener preference trends and the usage of a dummy head that are embedded within the derivation of Harman’s curves. So the Griesinger approach is similarly coarse, but still more individual.
One might note a conceptual difficulty here. If a coarse individual curve yields enough accuracy for effective external sound, why does the Harman curve not do so?
This is because the Harman curve averages and controls for numerous other variables (as outlined above) that the Griesinger compensation process simply sidesteps.
Thus, it appears the difference from individual HRTF introduced by the Harman curve outstrip the loss of detail from only taking data points every one-third of an octave for the individual. Arguably, preferable, or what we consciously perceive as accurate tonality (per Harman), is a less stringent target than the accuracy needed for spatial fidelity.
Sonarworks Curve
This automated equalization app has gained a lot of popularity, making much headway in traditionally equalization-resistant communities. While their proprietary calibration curve is not released, a company representative briefly commented on it on Reddit, saying it is similar but not identical to the Harman curve. Thus, the analysis on the methodology of Harman curves throughout this article series should still apply.
Etymotic Curve
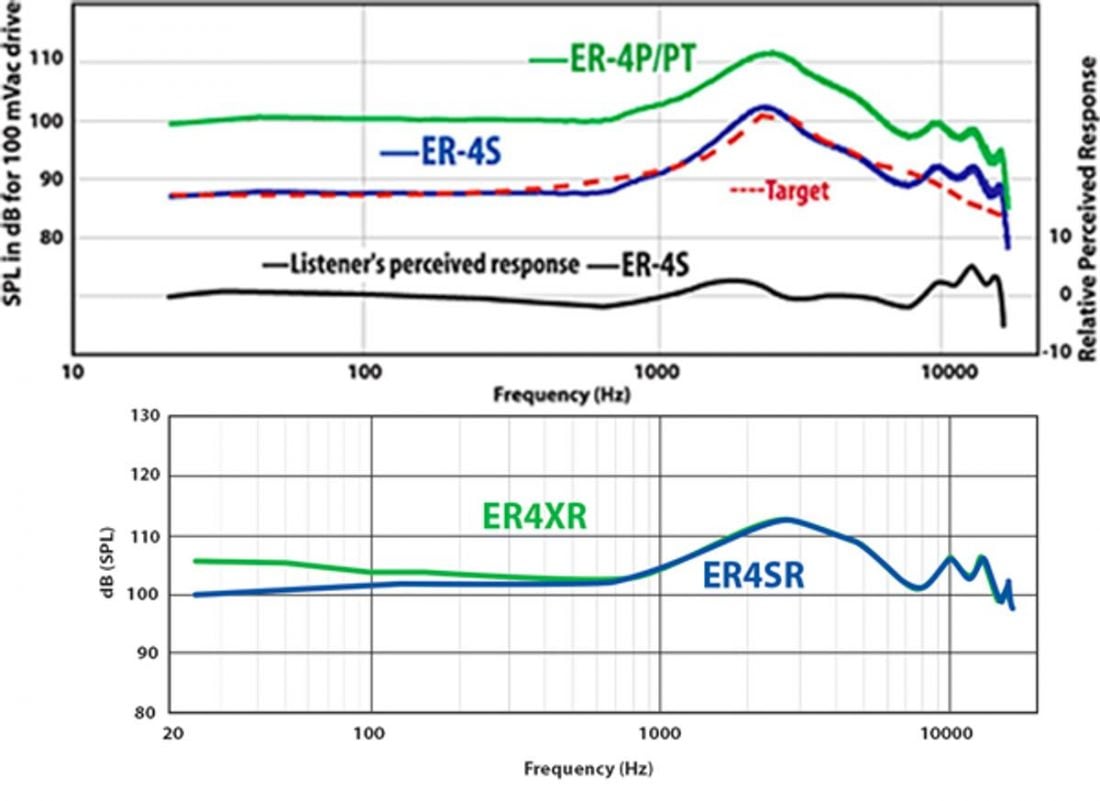
Etymotic, reputed as one of the most engineering-centric IEM manufacturers, uses a modified diffuse-field curve. Thus, much of the discussion on diffuse-field above applies. It will be much more bass-light and brighter than any default Harman curve. Etymotic explains their modifications as such:
However, no detail as to how they arrived at the “modification” is offered. It is nonetheless a derivation from the idealized abstraction of the diffuse-field curve.
Siegfried Linkwitz
Legendary, and sadly-departed, audio engineer Siegfried Linkwitz was one half of a duo that originated one of the most foundational and profound innovations in audio engineering: the Linkwitz-Riley crossover. Inspired by colleague Russ Riley, Linkwitz developed a crossover design that gave a flat frequency response with a smooth phase response that is still a de-facto standard today. Less known was Linkwitz’s informal experiments with IEMs, and the method he devised for individualized equalization.
He was a proponent for crossfeed, recognising its value for stereo recordings recorded with widely-spaced microphones. His analysis was consistent with the discussion in Parts 1 and 2: wide spacing yields unrealistic binaural cues embedded in the recording. The playback would be better off with the new (sub-700Hz or so) cues generated by the crosstalk of the stereo playback technique to reduce the unnaturalness.
He derived his individual calibration curve slightly differently from Griesinger: without using a speaker reference, and using sine waves continuously swept up the entire audioband, instead of pink noise at selected frequencies.
Using such sweeps on his Etymotic ER4S, Linkwitz identified resonant frequencies through sudden changes in loudness as the sweep swept through the audioband. He then equalized what he heard as peaks until the loudness of the sweep sounded uniform through the audioband.
Notably, he inserted the earphones much shallower than the intended depth (Etymotics being famous for requiring very deep insertion to push resonances resulting from sealed ear canals to very high frequencies), and equalized out two perceived peaks at 2.5kHz and 7.5kHz to shape the diffuse-field response to his own ears and preferred insertion depth. This is an alternative approach to non-invasive loudness comparison.
Conclusion
It is obvious we all hear differently. But the mere fact that we are all the same human species means we share some broad similarities – for one, ears with similar features that differ only in the details; head sizes and ear positioning that are more alike than dissimilar. Using all these, plus the tools of consumer research, Harman arrived at an average result that is consistent with these broad physiological similarities and consumer preference.
This is an outcome of the smoothing effect that emerges from controlling so many variables to make it appealing to the largest number of people within the parameters of their experiments.
Yet, there are other forms of corrective techniques to improve fidelity that it might not address, such as those related to crosstalk. There is also room for further individualization to one’s curve, but that requires using at least specialized test tones and equalizing to equal loudness – not most-preferred, because preference, as the Harman researchers concede, can be extremely dynamic within limited bounds (eg. recording tonal balance as discussed above).
Compared to this dynamic variation, calibrating to your own ears is a more stable approach, at the expense of inconvenience, involvement and perhaps more mindfulness than the set-and-forget-and-roughly-tune-as-you-like-it approach of the Harman curve.
Pin this image to save article
Awesome series of articles – the Harman curve mysteries.
Having M50x (no money for better, waiting for HD58X), I somehow gravitate between different EQ settings, mostly depending on recording.
As mentioned in article, I admire Oratory 1990 work. I use Sonarworks True-Fi on my phone, however something like Onkyo Player has good enough EQ capabilities to create equalization curve that could be saved in EQ settings. Thanks for mentioning Herr Linkwitz, this man has done so much for audio community and LR crossovers are one most frequently used by many designers. Many people like me, from DIY community have a lot to thank him for his research in audio.
I would also mention diyaudioheaven site as good source for measurements, reviews and headphone modifications.
Thanks for the articles ????, excellent reading.
What’s the practical application of this? Manufacturers don’t publish their response curves, don’t compare them with the Harman curve, and there’s rarely a way for the user to adjust response to match Harman. (People buy with herd mentality instead, or some go with what reviewers claim is good, and if there’s an EQ option many just fiddle until they get something they like.) So what’s the evangelical plan here?
Yes, it’s still quite early, but automated EQ (especially to the Harman curve) has gained some traction with programmes such as Waves NX, HeSuVi, Sonarworks and the free AutoEQ (https://www.reddit.com/r/headphones/comments/92b08s/eq_settings_for_700_headphones/). There is admittedly still significant ignorance and/or resistance to EQ, founded on a suspicion of DSP that persists from when bad DSP implementations were in the market prematurely. But we all have to start somewhere…
Considering Autoeq which i use in wavelet, the corrective eq isn’t the exact opposite of error eq of a headphone. Even the oratory corrective curves are different to their error curves. Is it to match harman or something else?
k, tnx
interesting if it happens
not sure that is the reason for resistance to / ignorance about EQ, but partly maybe, okay
I mean, analog EQ based on proper (rarely done) measurement sounds wonderful also and improves things notably, but you cannot say that out loud
To some extant it doesn’t matter that we all hear differently. That’s already accounted for in us. We can all sit in a concert hall and hear differently, but the input is the same ( for arguments sake let’s forget about difference between seats). Can anyone argue that this input is wrong, that there is a better way to hear the Boston Symphony than actually hearing the Boston Symphony? Yes, we all hear it differently, but it’s the same exact input for everyone and that ONE input is the real deal for everyone. Sure some people might not want to hear the real thing (apparently old women want to hear less bass) and some might have real hearing deficiencies. But generally the fact that we hear differently doesn’t mean there is a different ideal input coloration. Things get a little more complicated with headphones because of the need to measure with an assumed HTF, but even then if FR measured in the dummy head matches between flat loudspeakers and the headphones, then that will probably be pretty close to true sitting on any ear give or take effects from seal differences or the extent to which driver location matters.
Aye but the goal as I understand it (my understanding being albeit limited) is to transport that Boston symphony as accurately as possible to as many people as possible. And for that, we need to understand how hearing differs across these people.
Otherwise, instead of everyone hearing the real Boston symphony differently, everyone instead hears a different Boston symphony differently.