Breaking down the audio frequency spectrum, band by band.
The audio frequency spectrum spans the frequency range of 20 to 20,000 Hz, defined by the lowest and highest frequencies perceivable to a healthy human ear.
Understanding the qualities and characteristics of various frequency bands within this range, however, requires some examples and background context.
Whether you’re working on a mix or tweaking some equalizer settings, we’ll help you make practical sense of the technical concepts and subjective terminology underpinning the audio frequency spectrum.
What Does Frequency Mean in Audio?
To understand exactly what frequency refers to in the audio frequency spectrum, we need to take a closer look at the structure of a sound wave.
A sound wave propagates through the air by expanding and contracting air particles. The expansion part of this process is known as rarefaction, while the contraction is called compression. A sound wave rapidly oscillates between these two states, back and forth, over and over. A single one of these oscillations is called a wave cycle.
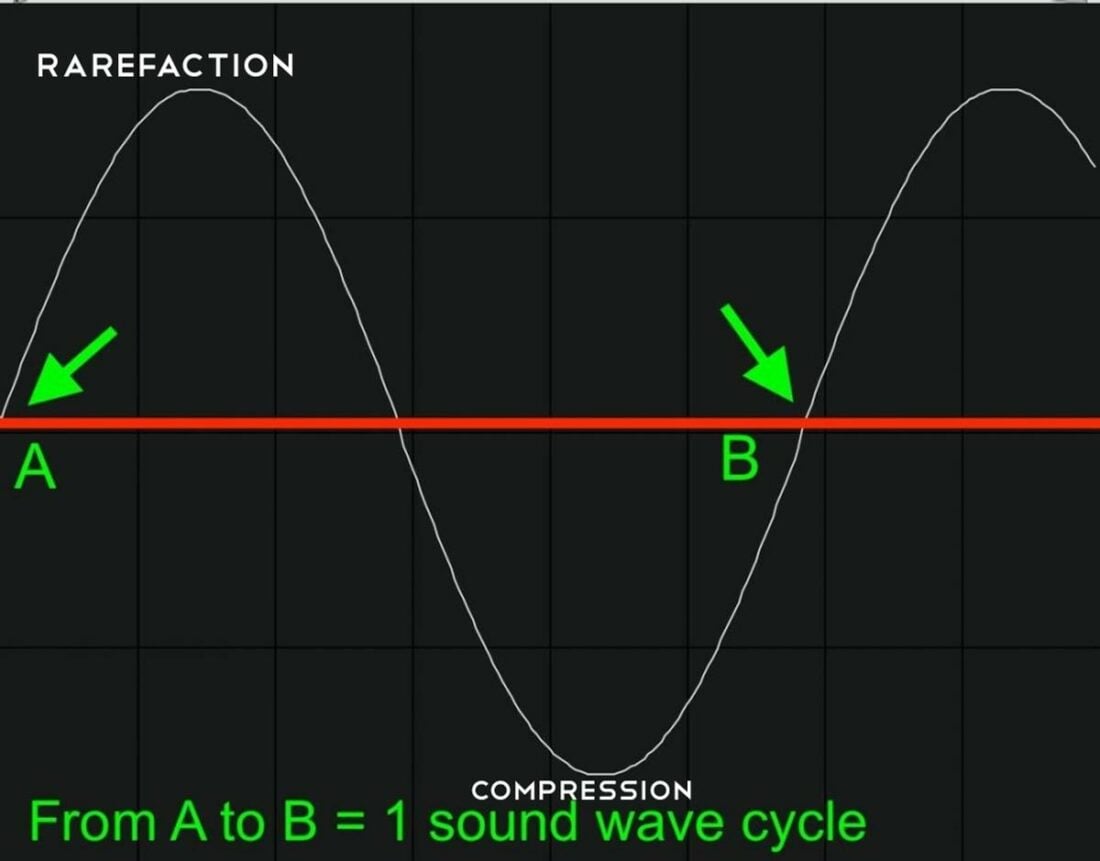
For example: if a sound wave compresses and rarefacts air particles once per second, this means it undergoes 1 wave cycle per second, and is thus defined as a 1 Hz frequency.
The relationship between frequency and pitch
Pitch and frequency have a direct logarithmic relationship with one another. It is direct in the sense that lower frequencies produce lower pitches, while higher frequencies produce higher pitches.
The logarithmic element of their relationship refers to how frequency and pitch directly correlate with one another. This relationship between pitch and frequency is mapped as follows:
This can be simply demonstrated with an example: a 40 Hz sound wave produces a pitch that is an octave above the pitch produced by a sound wave at 20 Hz. 80 Hz will produce a pitch 2 octaves above the one produced at 20 Hz (20 Hz*2 = 40 Hz, then 40Hz*2 = 80), and so on.
Categorizing Frequency Ranges in the Audio Frequency Spectrum
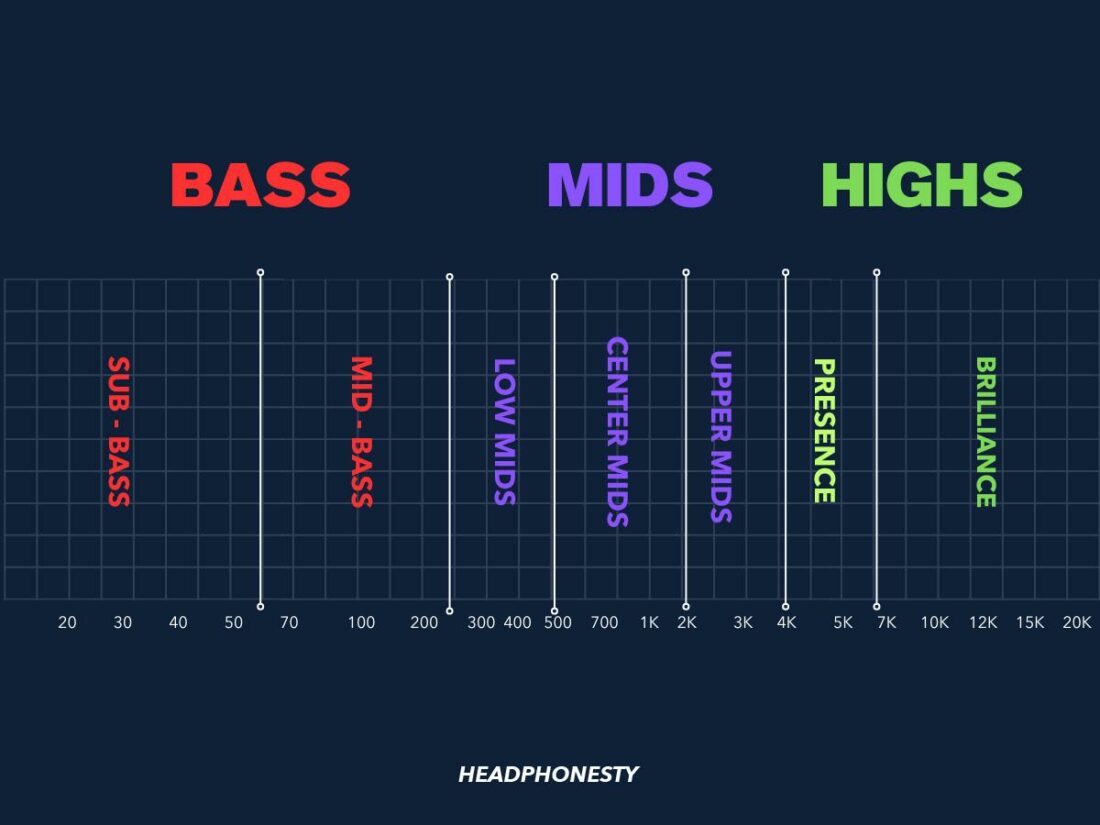
To make a subjective sense of the tones and pitches associated with different frequency ranges within the audio frequency spectrum, people often categorize frequency content as belonging to either the lows, mids (midrange), or highs (also called treble).
Within these broad categories are more specific subcategories (also known as frequency bands, or ranges), giving us the following to define:
| Broad category | Subcategory | Frequency Range | Helpful associations |
|---|---|---|---|
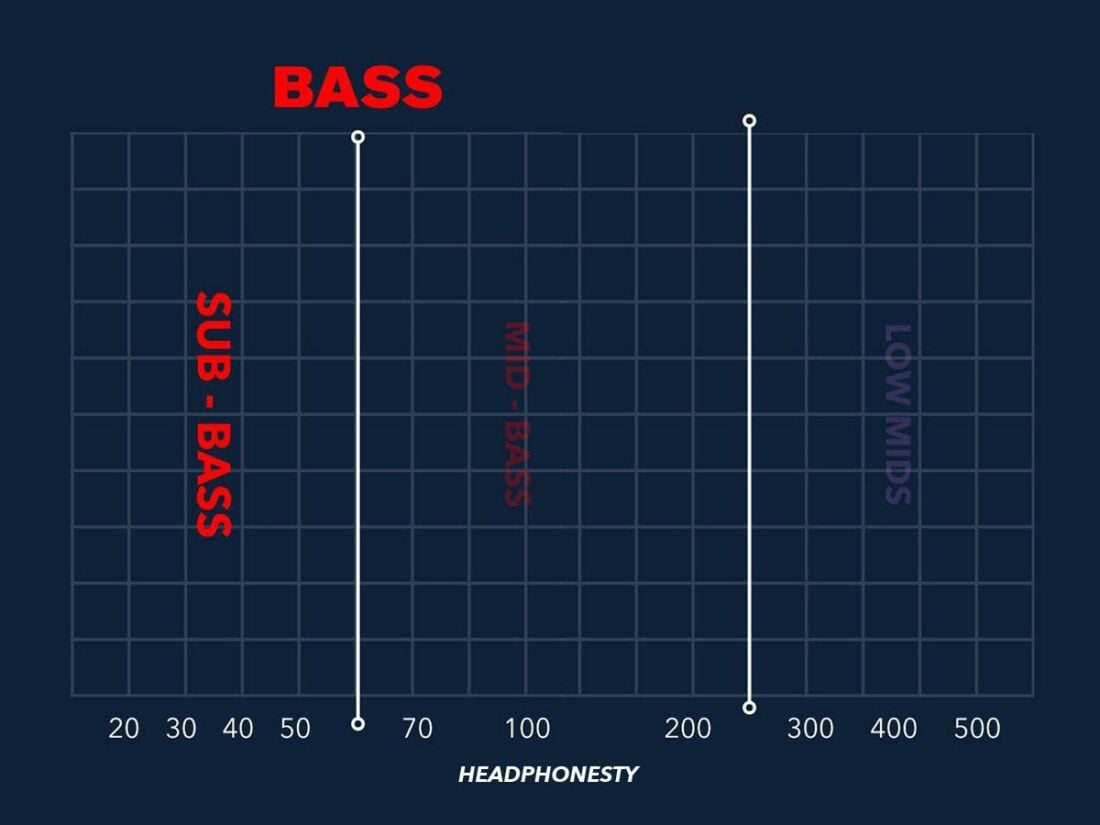
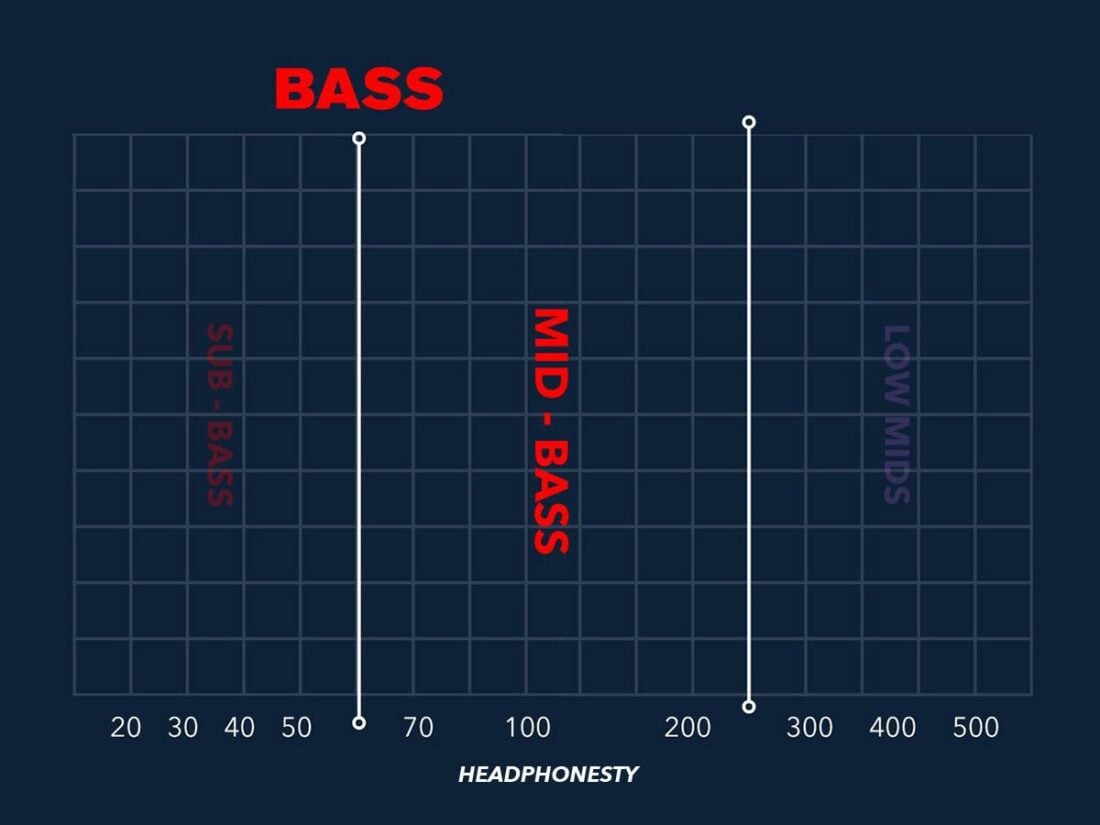
| Lows | Sub-bass | 20 - 60 Hz | Thunder, synth bass |
| Lows | Mid-bass | 60 - 250 Hz | Kick drum, bass guitar |
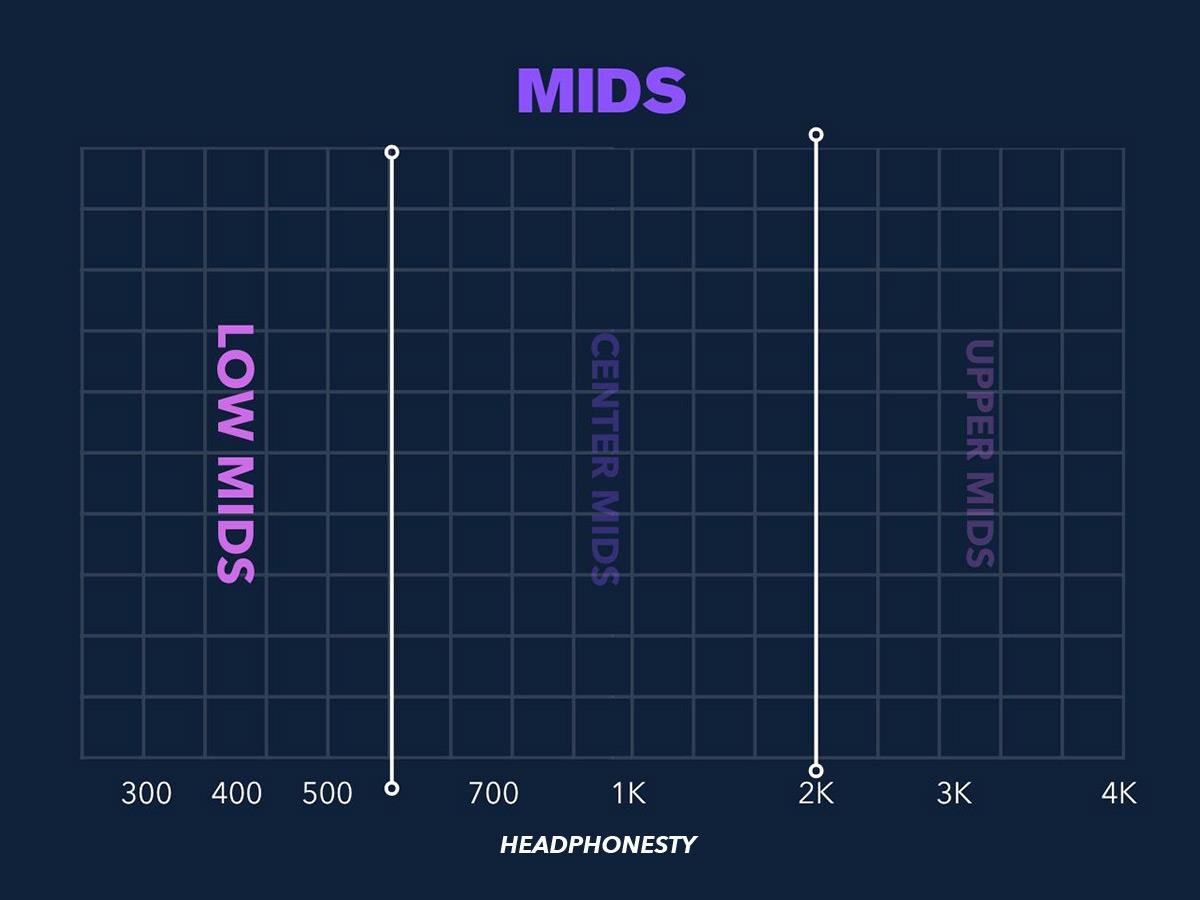
| Mids | Low-mids | 250 - 500 Hz | Vocals, guitar |
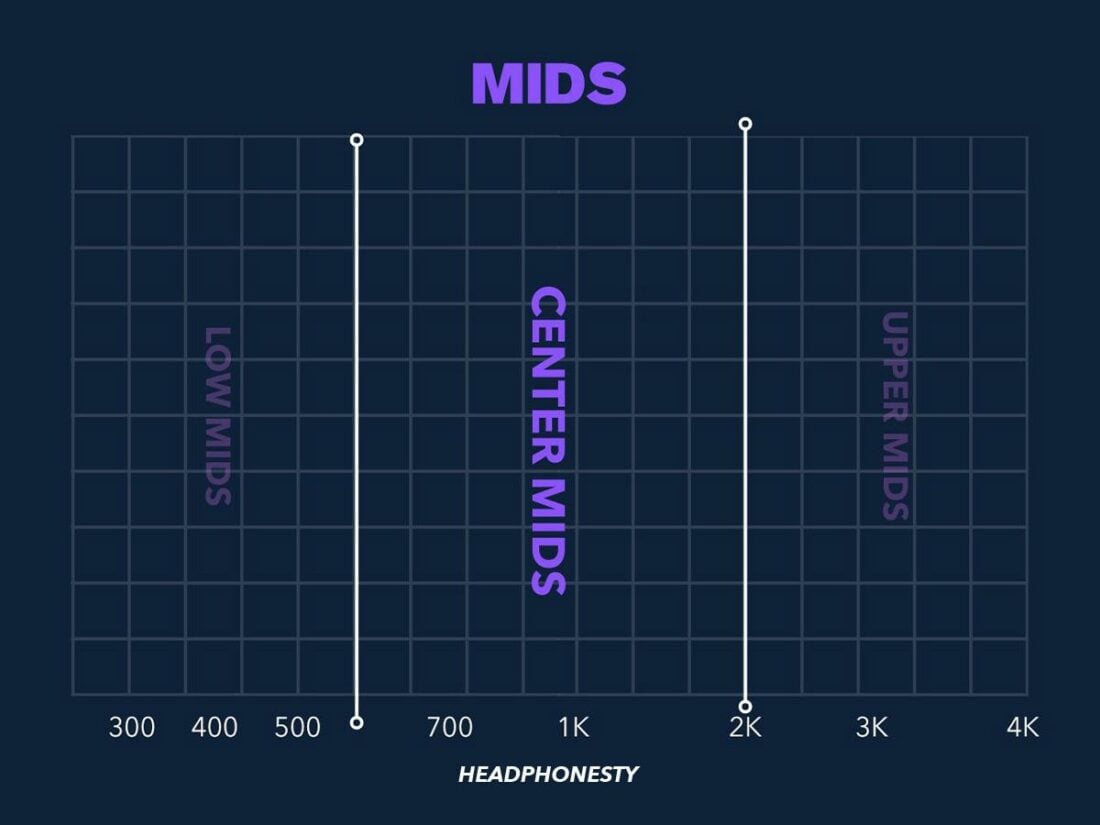
| Mids | Center-mids | 500 - 2000 Hz | High vocals, snare drum |
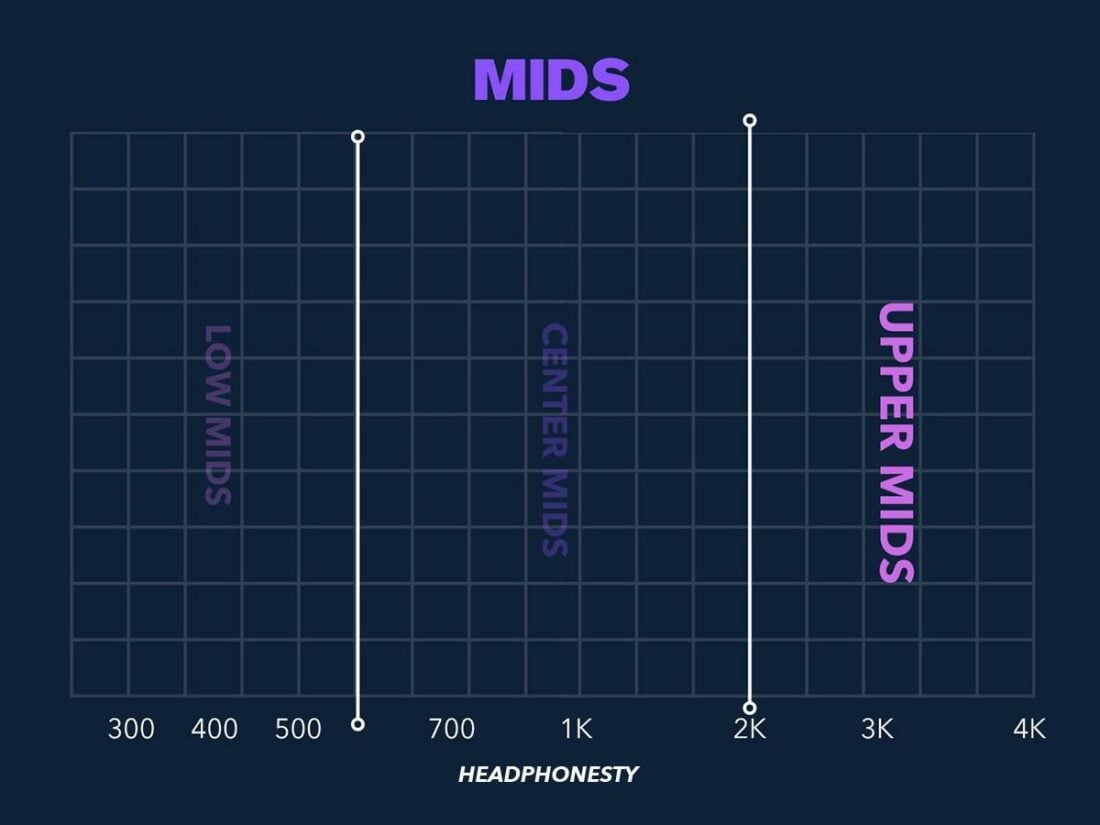
| Mids | High-mids | 2000 - 4000 Hz | “Ch” sound |
| Highs | Presence | 4000 - 6000 Hz | “Tss” sound |
| Highs | Brilliance | 6000 Hz - 20,000 Hz | Breath, buzz |
Take a moment to listen to the sample frequencies below to familiarize yourself with the tonal qualities that you can expect to hear in each frequency range:
The precise start and end points for the above frequency bands aren’t definitively established, so you’ll likely come across some variation depending on the person or community you’re speaking with.
For example, some people might say sub-bass spans from 20 – 80 Hz.
However, nitpicking the precise start and end points of these bands is less important than familiarizing yourself with their tonal and timbrical characteristics.
Let’s get into an overview of what those are.
- Sub-bass (20 – 60 Hz)
- Mid-bass (60 – 250 Hz)
- Low mids (250 – 500 Hz)
- Center mids (500 – 2000 Hz)
- Upper mids (2000-4000 Hz)
- Presence (4000-6000 Hz)
- Brilliance (6000 Hz – 20 kHz)
Sub-bass (20 – 60 Hz)
Sine wave demo (40 Hz):
The absolute lowest pitches in the audio frequency spectrum belong to the sub-bass frequency range. Sub-bass is often felt more than it is heard, leaving us with more of a rumbling impression rather than an easily recognizable pitch.
If you’ve ever been to a loud concert and felt like your stomache was getting pushed into your chest, congratulations: you found the sub-bass.
Too much sub-bass can produce an unnaturally “overpowering” effect. While the earth-shaking power can be impressive, the other frequency bands in your mix or EQ settings can become overshadowed and lose their distinction. Cutting frequencies below 30 Hz is a common technique I personally use for adding subtle definition to a mix.
Mid-bass (60 – 250 Hz)
Sine wave demo (100 Hz):
Mid-bass is where low frequencies become recognizably tonal rather than physical. It’s in this frequency range that we hear the prominent frequencies of basslines and kick drums.
Too much mid-bass in mix or audio balance can make it sound overly “boomy” or “fat.” Too little mid-bass can make a balance sound “thin” or “weak” with understated low-end impact.
Low mids (250 – 500 Hz)
Sine wave demo (350 Hz):
As one might imagine, the low mid frequency band serves as a gradient where the low-end of a mix transitions into the midrange. Parts like vocal fundamentals, rhythm guitars, and higher tom-toms often find a heavy presence in the low-midrange of the audio frequency spectrum.
An excessive amount of low mids in a balance or mix can result in a muddled and indistinct tone that eats away at a coherent separation between low-end and midrange parts. Conversely, an underdone low-mid balance can be described as sounding “cold” or “sterile.”
A low-mid balance that’s just right, however, can bring a pleasant “warmth” into the body of a mix.
Center mids (500 – 2000 Hz)
Sine wave demo (1200 Hz):
The center-midrange frequency band is often the busiest part of a mix. It is rife with harmonics and fundamentals from the “core” parts of the mix, such as vocals, guitars, drums, and keyboards.
Overboosting your center mids can create a “boxy” sound (like cupping both of your hands over your mouth and speaking into them). Undergoing the center mids, on the other hand, can make a mix sound unnaturally “distant” and cede too much presence to the extremes of the audio frequency spectrum.
Upper mids (2000-4000 Hz)
Sine wave demo (3000 Hz):
The upper mids are a frequency range that warrants careful consideration when adjusted. Our ears are most sensitive to frequencies in this range, as our ear canals resonate and amplify frequencies around 3.5 kHz.
Much of what we hear in this range consists of transients, harmonics, and timbre details. Overamplification in this range will sound especially harsh due to the natural amplification our ears provide in this area of the audio frequency spectrum. You will certainly know what “too much” is when you hear it – it can quickly give you an unavoidable headache.
Too little emphasis in this range, however, will also be highly noticeable. Parts can sound awkwardly “empty” and lack high-frequency impact (like a pick hitting a guitar string).
Presence (4000-6000 Hz)
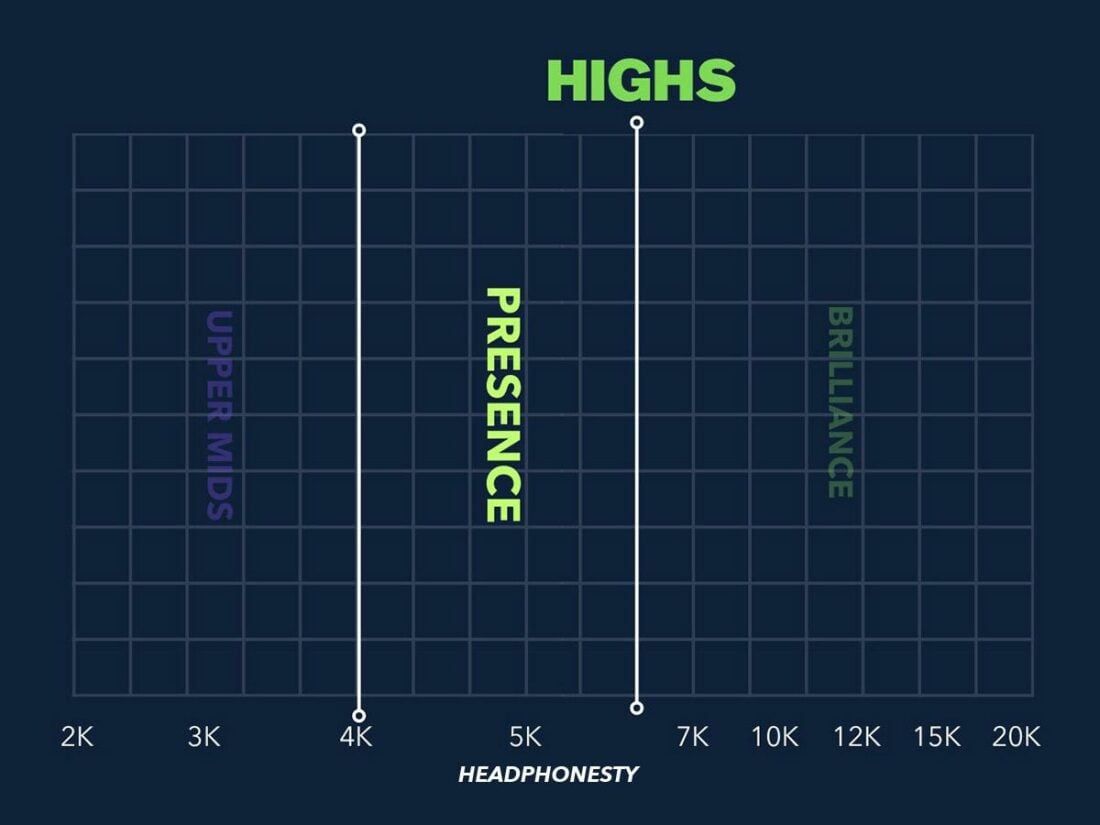
Sine wave demo (5000 Hz):
The presence range of frequencies is by-and-large dominated by harmonic frequencies. “S” sounds in speech, also known as sibilants, are also notorious for lingering in this band.
Overdoing the presence range can result in an overly “edgy” or shrill sound, bringing out some of the uglier, jagged tones on distorted guitars. Too little presence can introduce a distinct muffled character that leaves a mix sounding incomplete.
Brilliance (6000 Hz – 20 kHz)
Sine wave demo (10000 Hz):
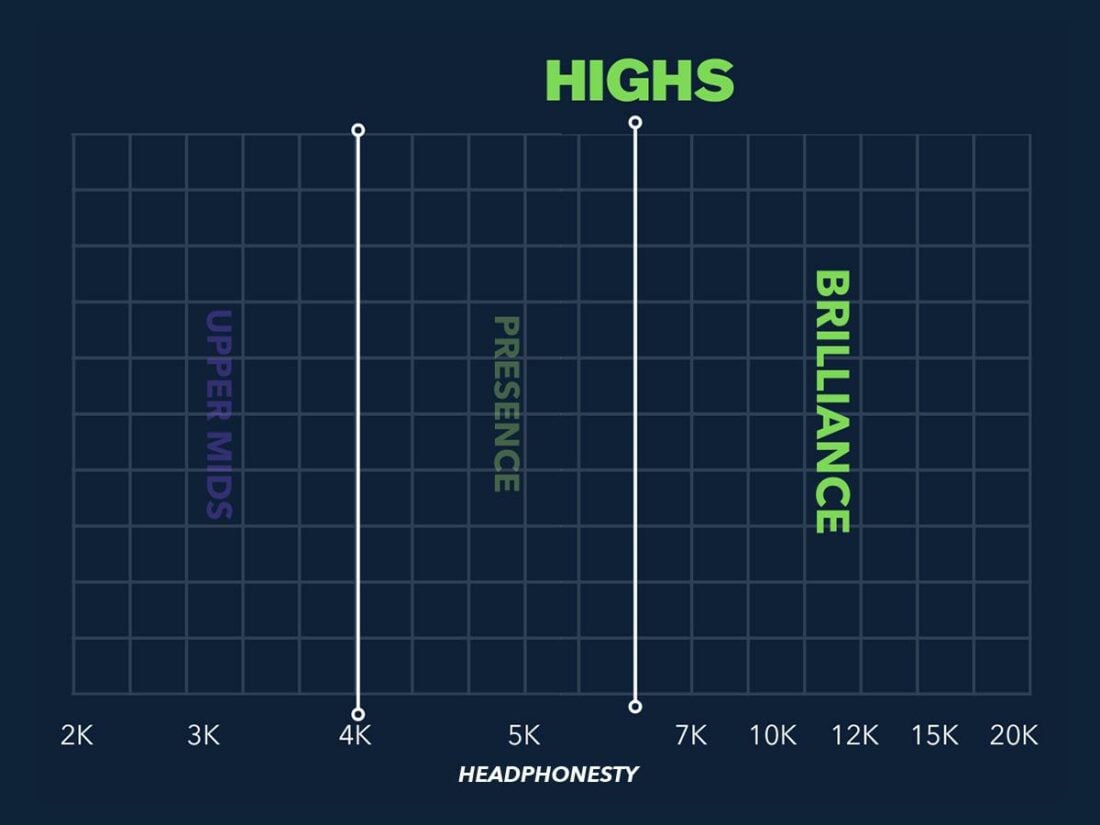
The frequencies in the brilliance range contain audio information that is a little difficult to pinpoint to any one particular instrument or sound.
Like the low, sub-bass frequencies in the audio frequency spectrum, the high frequencies in the brilliance range mostly inform the overall timbre of a recording rather than its tonality. If you listen to a recording of someone playing a wind instrument, the breathy and buzzy details in the recording often fall in this range.
When balanced right, brilliance provides “air” and “openness” to a recording. Getting heavy-handed in this range might make a mix sound “glassy,” and can amplify the unpleasant hiss of a recording’s noise floor. Over-attenuating this range, on the other hand, can impart a “deadened” or “dampened” sound.
How to Read a Frequency Response Chart
Frequency response charts are used to map the amplitudes of different frequencies across the audio frequency spectrum. Amplitude is the measured intensity of a sound, and uses decibels (dB) as its unit.
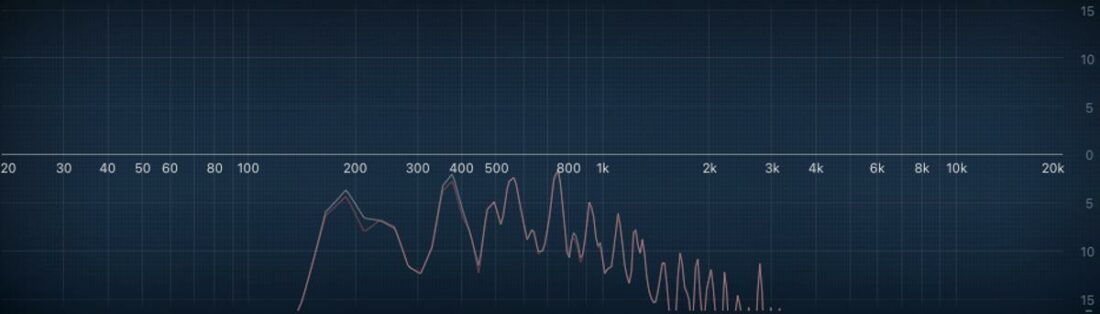
The default equalizer in Logic Pro was used with an active frequency analyzer to create the frequency response chart above. Frequency values (Hz) are assigned to the X-axis, while positive and negative amplitude values (dB) are assigned to the Y-axis.
The off-color, jagged line running across the chart is a snapshot of frequency levels for a particular sound in a mix.
Some examples of observations we can make about the frequency content of this particular sound based on the above chart:
- It lacks frequency content below approximately 140 Hz and over 3 kHz
- It contains amplitude peaks at approximately 190 Hz, 380 Hz, 550 Hz, and 750 Hz
- Its frequencies gradually diminish in amplitude from around 1 – 3 kHz
Important Concepts Related to the Audio Frequency Spectrum
On top of the previous concepts pertaining to the audio frequency spectrum in this article, there are a few other terms and ideas that will help reinforce this knowledge. Below are some definitions that will help you better understand discussions around frequency.
Resonant frequency
Resonant frequency refers to the frequency at which a physical object vibrates most strongly when exposed to it. It will briefly amplify this frequency before the energy from the sound wave begins to dissipate. The resonant frequency of an object is heavily determined by its size, shape, density, and materials.
Fundamental frequency
A fundamental frequency is the lowest, baseline frequency of a sound, and usually determines its perceived pitch. An example for the guitar players reading this: the fundamental frequency of the lowest string of a guitar in standard tuning is 82 Hz, better known as low E.
Harmonics
Harmonics can be understood as additional frequencies that radiate off of a fundamental frequency – specifically, they are the integer multiples of the fundamental frequency of a given sound. Harmonics contribute to the timbre of a sound.
Frequently Asked Questions
- What are the highest and lowest frequencies on a piano?
- Can humans hear over 20,000 Hz?
- What animals can hear the highest and lowest frequencies?
What are the highest and lowest frequencies on a piano?
On an 88-key piano, the lowest key (D0) plays at 27.5 Hz, while the highest key (C8) plays at 4,186 Hz.
Can humans hear over 20,000 Hz?
In the vast majority of cases, humans cannot hear frequencies above 20,000 Hz. However, studies have found that humans can hear up to 200 kHz frequencies specifically when underwater, thanks to bone conduction.
What animals can hear the highest and lowest frequencies?
Pigeons are able to hear frequencies as low as 0.5 Hz, while the greater wax moth can hear frequencies as high as 300 kHz.
Excellent article! It addresses the topic with clarity and helpful examples. Having just purchased a good pair of IEMs I have just begun to appreciate details in the music. (That is not always a good thing, as I am now able to detect sibilance and other flaws as well.) This article gives me a blueprint for what I am hearing. Great job.
Very good article, relevant today and future as I am just getting back into Hi-Fi audiophile.
Would love to know if the reproduced in the Sine Wave demo were from sealed or ported enclosures
Thanks
I’m a young music producer who has just started in music production recently and by reading this article it really helps me to understand more on how to EQing my tracks properly! Thank you very much Alan!
I personally can forgive a pair of headphones for not having stellar bass and treble frequencies, but it has to get the mids right. Midranges that sounds too recessed, dips, and peaks, that causes the nasal effect can be distracting even for some non-audiophiles lol.
Great article just what I needed